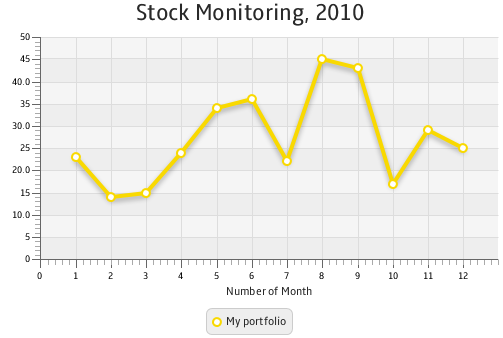
JavaFX has some relatively decent chart API's. Oracle has posted several basic tutorials on getting started with charts and since I'm doing some work on creating interactive charts, I've been working through the tutorials. At
http://docs.oracle.com/javafx/2/charts/line-chart.htm they have a simple line chart example, I thought I'd take a moment to write it using
ScalaFX. Below are examples of JavaFX and ScalaFX code that will produce the following window:
JavaFX Version of LineChartSample
import javafx.application.Application;
import javafx.scene.Scene;
import javafx.scene.chart.LineChart;
import javafx.scene.chart.NumberAxis;
import javafx.scene.chart.XYChart;
import javafx.stage.Stage;


public class LineChartSample extends Application {

    @Override public void start(Stage stage) {
        stage.setTitle("Line Chart Sample");
        //defining the axes
        final NumberAxis xAxis = new NumberAxis();
        final NumberAxis yAxis = new NumberAxis();
        xAxis.setLabel("Number of Month");
        //creating the chart
        final LineChart lineChart =
                new LineChart(xAxis,yAxis);

        lineChart.setTitle("Stock Monitoring, 2010");
        //defining a series
        XYChart.Series series = new XYChart.Series();
        series.setName("My portfolio");
        //populating the series with data
        series.getData().add(new XYChart.Data(1, 23));
        series.getData().add(new XYChart.Data(2, 14));
        series.getData().add(new XYChart.Data(3, 15));
        series.getData().add(new XYChart.Data(4, 24));
        series.getData().add(new XYChart.Data(5, 34));
        series.getData().add(new XYChart.Data(6, 36));
        series.getData().add(new XYChart.Data(7, 22));
        series.getData().add(new XYChart.Data(8, 45));
        series.getData().add(new XYChart.Data(9, 43));
        series.getData().add(new XYChart.Data(10, 17));
        series.getData().add(new XYChart.Data(11, 29));
        series.getData().add(new XYChart.Data(12, 25));

        Scene scene  = new Scene(lineChart,800,600);
        lineChart.getData().add(series);

        stage.setScene(scene);
        stage.show();
    }

    public static void main(String[] args) {
        launch(args);
    }
}
ScalaFX Version of LineChartSample
import scalafx.application.JFXApp
import scalafx.stage.Stage
import scalafx.scene.Scene
import scalafx.scene.chart.{LineChart, NumberAxis, XYChart}
import scalafx.collections.ObservableBuffer

object LineChartSample extends JFXApp {

  // Defining the axes
  val xAxis = new NumberAxis
  xAxis.label = "Number of Month"
  val yAxis = new NumberAxis

  // Creating the chart
  val lineChart = LineChart(xAxis, yAxis)
  lineChart.title = "Stock Monitoring, 2010"

  // defining a series
  val data = ObservableBuffer(Seq(
    (1, 23),
    (2, 14),
    (3, 15),
    (4, 24),
    (5, 34),
    (6, 36),
    (7, 22),
    (8, 45),
    (9, 43),
    (10, 17),
    (11, 29),
    (12, 25)
  ) map {case (x, y) => XYChart.Data[Number, Number](x, y).delegate} )

  val series = XYChart.Series[Number, Number]("My portfolio", data)
  lineChart.getData.add(series)

  stage = new Stage {
    title = "Line Chart Sample"
    scene = new Scene(800, 600) {
      root = lineChart
    }
  }
}


1 comments:
which version of scalafx should i use for this?
I am getting error in below lines
) map {case (x, y) => XYChart.Data[Number, Number](x, y).delegate} )
val series = XYChart.Series[String, Number]("My portfolio", data)
Cannot resolve symbol delegate
Cannot resolve Series
Post a Comment